Candidate |
Raw Vote |
Percentage |
Bush |
10,950 |
50% |
Kerry |
10,369 |
47% |
Nader |
483 |
2% |
Write-In |
252 |
1% |
Totals |
22,054 |
100% |
Polls closed 6:00 PM PST on October 29, 2004
Candidate |
Raw Vote |
Percentage |
Bush |
13,695 |
53% |
Kerry |
9,943 |
39% |
Nader |
689 |
3% |
Undecided |
1,309 |
5% |
Totals |
25,636 |
100% |
Polling data collected September 14th-30th, 2004
and includes some statewide polling numbers
Who got the most of the undecided vote in our election?
Who gained support since our September polling data?
Who lost support since our September polling data?
Did
defense and economic issues help Bush?
Did
campaign advertising help Kerry?
Could Kerry win if he had the Nader vote? The Write-In vote?
Is
this a decisive vote? Why or why not?
|
|
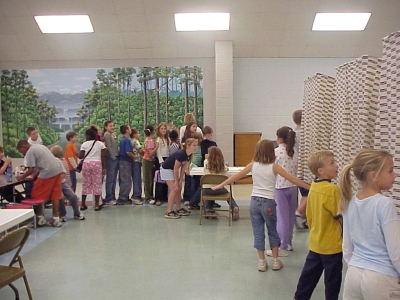
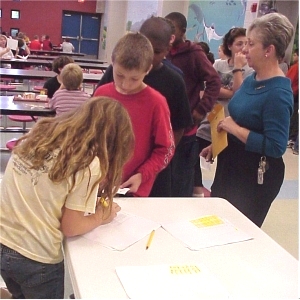
What an amazing day! We ran our "mock" election today with 3 "real" voting machines from the Board of Elections. A total of 783 students (prek-5 with special ed), teachers, and staff voted. 560 voted for Bush, 260 for Kerry, 21 for Nader, and 11 for Badnarik. (We'll have to research him!) The 3rd and 4th grade GT students ran the precinct, from looking at "mock" Voter ID's to marking each student as voting, to helping with voting booth, to clearing data for next vote.
|
Students and teachers were so excited to be using the "real" machines, making them "just like adults." Our election news has spread to our Superintendent and we're going to have pictures published. The kids learned so much. Wonderful project! This was really a great day!
Ms.Wilkes
North Augusta, South Carolina
|
|
|